
Market recap:
OK to begin with ... Hey Bob, Great call this morning while the market was soaring. Yep KumoBob called it again. "The Buck Stops Here"
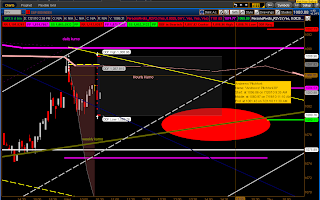
Remember I told you back on 7/7/2010 in the market recap, and then on 7/9/2010 I drew in a red oval target with an explanation of why this was the target.
Today's Black candle created a Bearish Dark Cloud Cover Pattern. A very welcome sight for the Bears. This is a strong pattern, but it would be correct to wait for a conformation from a second Black Candle. Remember once the Bulls loose grip there will be Hell to pay.
Price remains trapped within the Hourly Kumo, and between the Daily and Weekly Kumos.
Look at the 20DMA @ 1075, 50DMA @ 1091, 200DMA @ 1089 and 255DMA @ 1075. I believe these averages are still influencing Price, and the crossings are a signal. and this is all happening at the convergence of several major forks.
The daily, and hourly indicators are either Bearish or on the edge of Bearish.
I expect one of two scenarios tomorrow. We either break to the lower side of the red fork and get this bear market rolling or we crawl up along the edge of the Hourly Kumo to the Weekly Kumo and then break down and out of the trading range, crossing the Red Handle.
Dropping below the red handle will send the market back to the 1040 shelf. Breaking the 1000 barrier will begin a barrage of selling to the 950 area.
// End Market recap 2010.07.21 //
10:35 ET
DDF and Forks

Analysis presented on this Blog has only informational, and educational purpose, and does not represent a proposal for buying or selling contracts, equities or currency.


No comments:
Post a Comment