Linear Regression
I go by the rule "the trend is your friend", of course what time frame are we talking about?
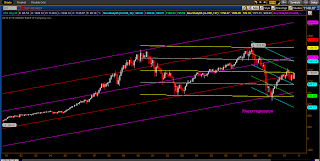
I've recently been writing indicators that use linear regression, so I wanted to do a study of the method, and look at the charts for clues about what that technique might reveal. In the process I made these charts, and thought I'd share them for what ever they are worth to others.
I've recently been writing indicators that use linear regression, so I wanted to do a study of the method, and look at the charts for clues about what that technique might reveal. In the process I made these charts, and thought I'd share them for what ever they are worth to others.
To me, the Linear regression chart from 1991 looks like it bounced off support back in March, and is now at a confluence of resistance.
I've been saying 945 because it's a Fibonacci ratio, but the Andrews Pitchforks, and these Linear Regression charts seem to agree that 945 area is a key support as well as what I refer to as a Chikou-Span support/resistance. Others would simply look at the price charts, and point out that there have been several peaks and valleys in the 945 area, but I like that the Japanese actually gave it a name . If the market falls, the 945 area will definitely be a support level.
I try not to be influenced by fundamentals but it's hard not to see disaster ahead. Powerful people have managed to keep securities up, but there will come a day when the emperor will be seen without his clothes. According to trend lines, and Andrews Pitchforks it should be soon.
1991
This Blog has only informational, and educational purpose, and does not represent a proposal for buying or selling contracts, equities or currency.


No comments:
Post a Comment