The End of Small Farms? HR 2749, HR 875, HR 759, NAIS & Monsanto - Shelly Roche

17:40 PST
I was once a census taker. It was a great temp job, but here's something to thing about before you answer those seemingly benign questions.
The Census Is Getting Personal
 14:15
14:15Volume suggests that we are close to a peak.
13:30
You saw it here first. The chart below shows us in a double zigzag. There are two possibilities. We could peak at 1112 with wave Y equaling wave 1 for a 62 % retrace or wave Y could extend to the 72.8% retrace at 1130.
This is all according to EW which is the best 20/20 hind site indicator I know of. I'm still pissed a that little jerk Elliott. He's about to loose this toys again!
Hourly MoneySpy is close to a sell signal but it could be detecting a wave 2 while the larger trend continues to 1130. The pitchforks are signaling a crossroads.
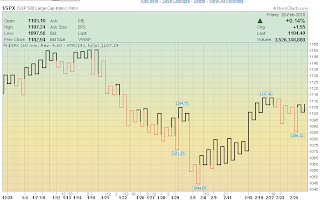
 The Hourly Kagi chart is indicating a Bullish reversal but the Ichimoku hourly is up against the top of it's hourly Kumo with a Bullish cross. Basically it's a complete toss, but if 1112 is broken I'd look for 1130 as the next peak.
08:30 PST
I must like to torture myself. Here's another illusive EW count.

07:30 PST
DDF is indicating a bearish bias for today's trend.
 Price is currently contained within the hourly Kumo. The important level for the bears to break is the green upward fork. Price has been ruled by this fork since July 12th.
 The Daily chart reveals a Bullish Tenkan-sen / Kijun-sen cross. Price continues to float within this Kumo with resistance near 1130
Analysis presented on this Blog has only informational, and educational purpose, and does not represent a proposal for buying or selling currency contracts.
No comments:
Post a Comment