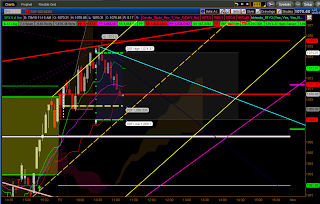
Smoothy is still green. If it does roll over I'm still thinking along the lines that Cooper mentioned. There is a weakness in the Hourly Kumo near the end of Tuesday. This may allow the market to fall, but if it turns back up off the lower red tine near the 1040 or the Weekly Kumo we will most likely see 1090. That is when I'll be watching my indicators, Smoothy, The Oracle and MoneySpy. I think Daneric is looking for something very similar.

11:30 ET
I'm not saying Price will go to the 1090 area, but I see a possible scenario if it should.
The chart below shows the Daily and Weekly Kumos. Notice the red oval I've drawn in. This is where Price may end up being sandwiched between the two Kumos. This would most likely cause the Bollinger Bands and the Keltner channels to cross resulting in a build up of market pressure and a violent move out of the trading range.

If the above scenario should work out it would also fall into line with some cycle work I've been experimenting with where the beginning of August appears to be significant.
11:10 ET
It appears that we may have peaked here. If not we have Fibonacci Ratios at 1081.49 & 1089.82.
DDF Is Bullish but The hourly Oracle is indicating a peak.
We are currently at the 50 and 200 day MA.

Analysis presented on this Blog has only informational, and educational purpose, and does not represent a proposal for buying or selling contracts, equities or currency.

marking time until the time band you mentioned; very plausible, note how /ES has not been moving overnight all of a sudden. One scenario is to drift to the middle red tine then bounce mid-month to peak in late July. IMO cycle work is a proxy for astrological analysis; e.g., whereas 2-/4- week lunar cycles obtain in the absence of greater planetary influences, when other influences are stronger then lunar cycle stops working.
ReplyDeleteThanks for your input Cooper. The cycle work I was playing with is based in Fibonacci.
ReplyDeleteBob
Who knows... it could just drop from here and not bounce either, but you're right that a bounce looks better and seems to fit the way that the current market is working. Not that the correlation is strong anymore but you may have noticed that EUR/USD broke a ST trendline/wedge today, found an unyielding ceiling at 1.265 and closed unimpressively.
ReplyDelete