

I have had little to say since this is the same forecast I made 10 days ago. So far Price has turned at the first three Fibonacci levels and the red fork does not appear to be far off the mark.
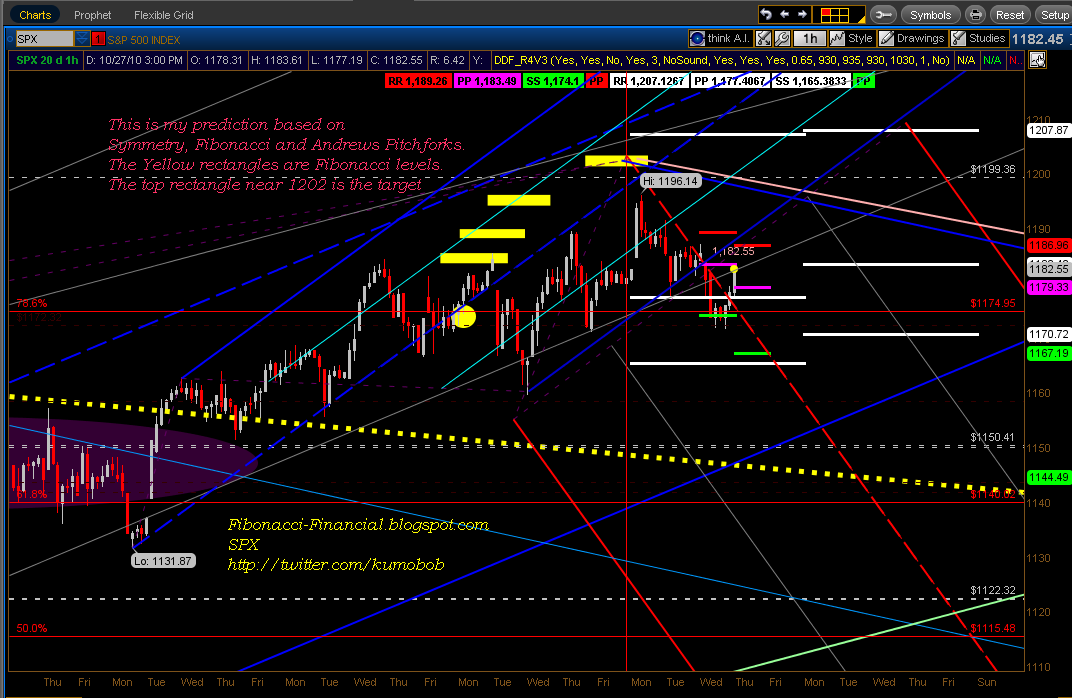
If these key levels give way, you should know that Price will find support near 1150, but should that fail, the 1137 area which happens to be where the trend line from 2007 and the peak of April 2010 sits, will catch the falling market.
At that point Price would be approaching the bottom tine of the July fork, and a bounce back to 1200 would still be a possible scenario.
I could go on, but lets see first if the avalanche begins.

The +1σ Standard Deviation Forecast Curve I presented on Wednesday is an interesting tool included with ToS. But it's a proprietary study which I spent the entire day trying to duplicate They say it's a +1σ standard deviation, but I have not been able to find a way to duplicate it. So +1σ of what? I should probably quit referring to it as a Standard Dev even though they refer to it as a Std Dev. Since ToS is being so secretive about the plot I have no way of knowing, but I'll continue to show it because it does appear to have merit.
 This is the "std dev " I drew about 24 hours ago. Of course it changes all the time, but I want to watch this one to see how well it does over time.
http://twitter.com/KumoBob
No comments:
Post a Comment