
The Hourly chart is beginning to show a Squeeze.
11:42 ET
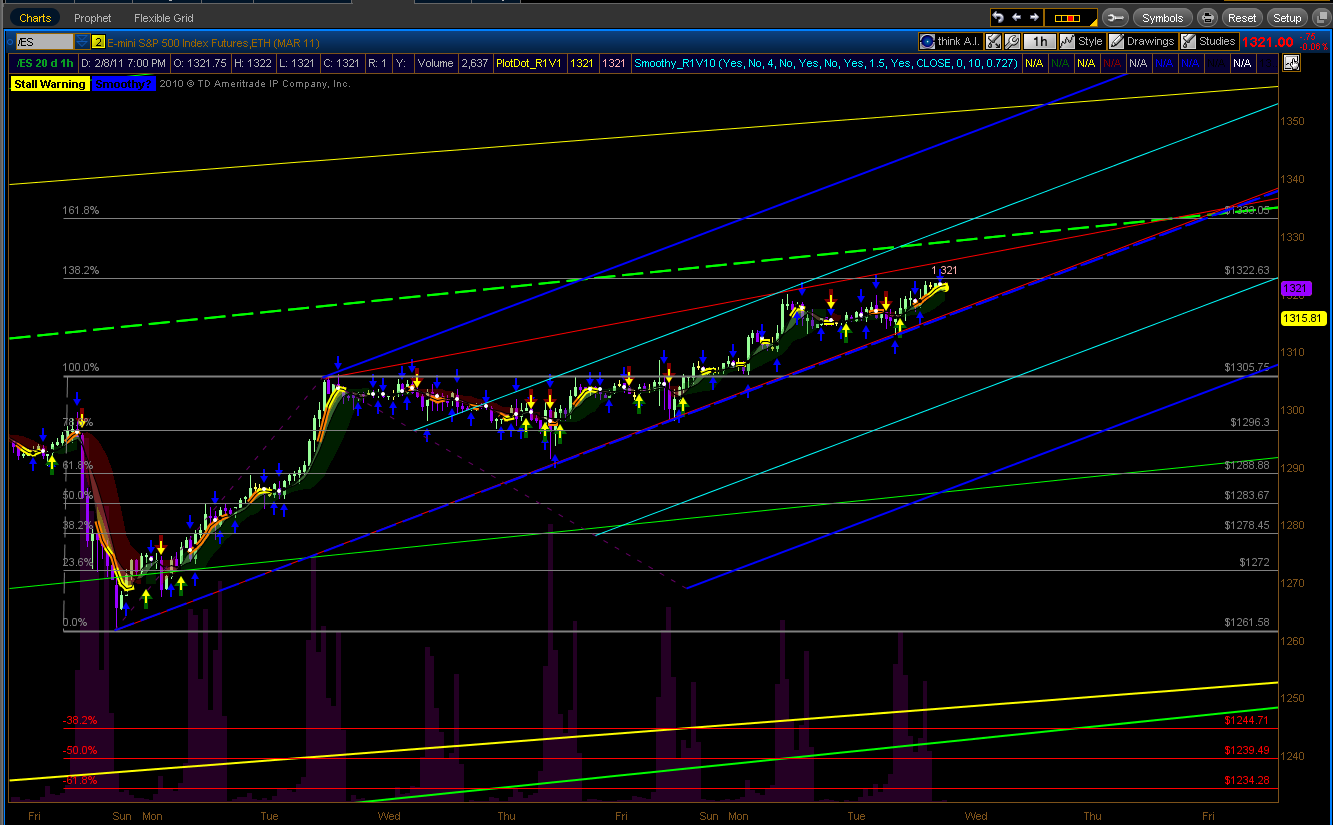
The yellow dot shows the current price. This is a different way of looking at the MonkeyBars than I showed you yesterday. In theory Price is being pushed above the fair range by day traders. Long term traders will either jump on board or reject the higher price.
All that aside I see that Price has respected the red trend line and still resides inside the upward forks, and is approaching the VWAP R1 pivot
It's difficult to say whether price will continue up past the R1 today, but my feelings are that if a major top is forming, it will not languish in a sideways range before dropping. Instead I'm looking for a strong upward push with a quick reversal.

Refering to the technical indicators below.
The phase cycles indicate a continuation of this upward trend.

My other indicators are also showing a Bullish bias.
Notice how Area51 has formed a tight signal. This is indicating a strong move.
Notice how Area51 has formed a tight signal. This is indicating a strong move.

No comments:
Post a Comment