


Current trajectory suggests 1297 as the immediate target and 1308 is the maximum bounce. Trend lines can accommodate a certain amount of flex, but it appears that this is a major turn.
Anyway you look at it, the trend line from March 2009 has been broken.
Finally a market that I can believe in!

16:15
It's was kinda like working with explosives today.
The Blue line is the bottom of the wedge. Potentially a launch point to higher prices. As I said in my last entry at 14:45; I am watching to see if we get a second touch and go off this line.
The trend line coming from March 2009 is crossing here too, so it's a very strong support, but if it breaks the market will most likely continue to slide after a pause at 1290.
It seems to be demonstrating a fine line between the two forces and it's all hanging on 1309.

14:45
I've been waiting a long time for this wedge to finish and it now looks complete. But the move off the bottom does not have the kick I was expecting. Sometimes the patterns just look good, but don't always deliver.
It may just need one more test of the bottom line, but I'm not feeling very Bullish.

If this level cracks, the yellow line will probably only offer a pause. Downside potential is huge.

12:03
This is on the edge!

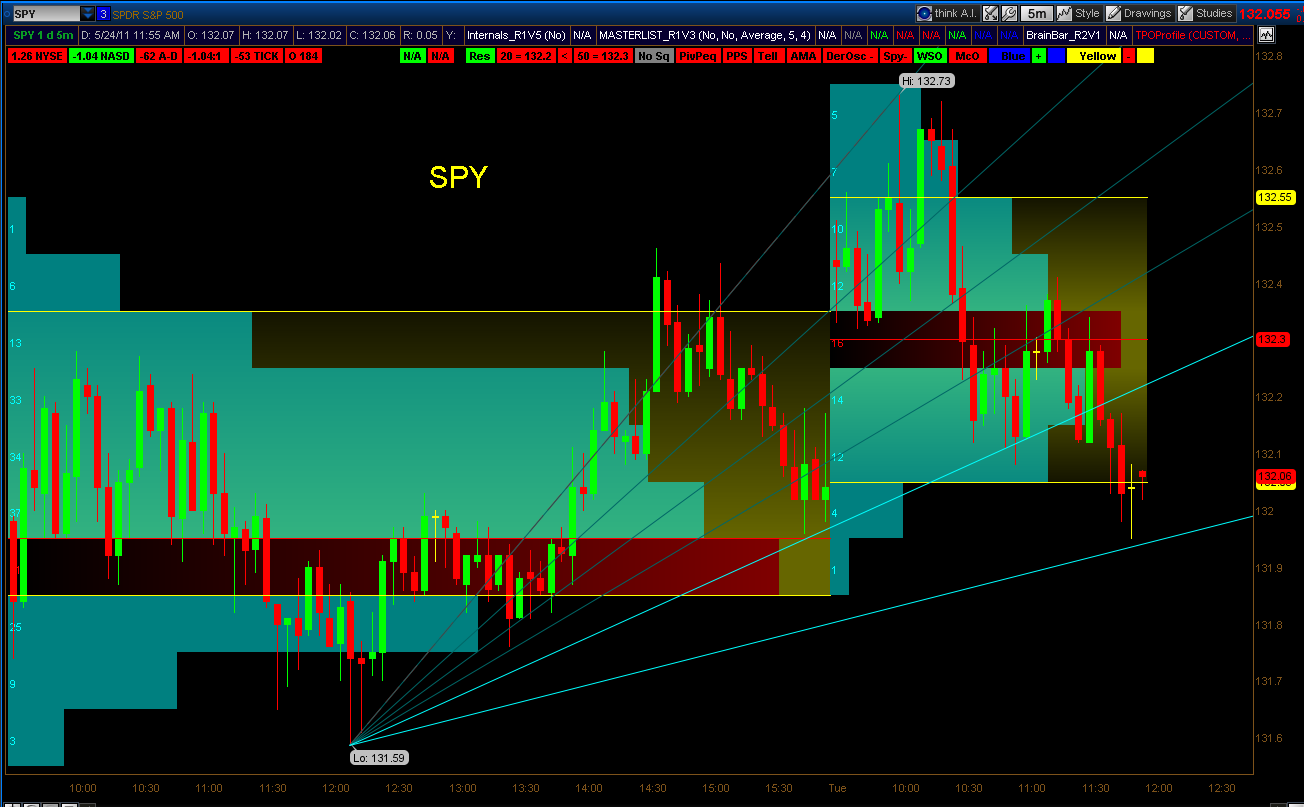
11:55

11:19

No comments:
Post a Comment