We broke the 1308 level, but I should have seen this before. Huge support near 1300.
15:00
Working through various ideas which include Fibonacci and Andrews Pitchforks, has lead me to conclude that 1360 is the target. A close below the 2009 trend line @ 1250 would change my mind ;-)
14:49
Elliott Wave is still engrained in me. What I see here is 5 waves, which may indicate a bullish impulse wave.
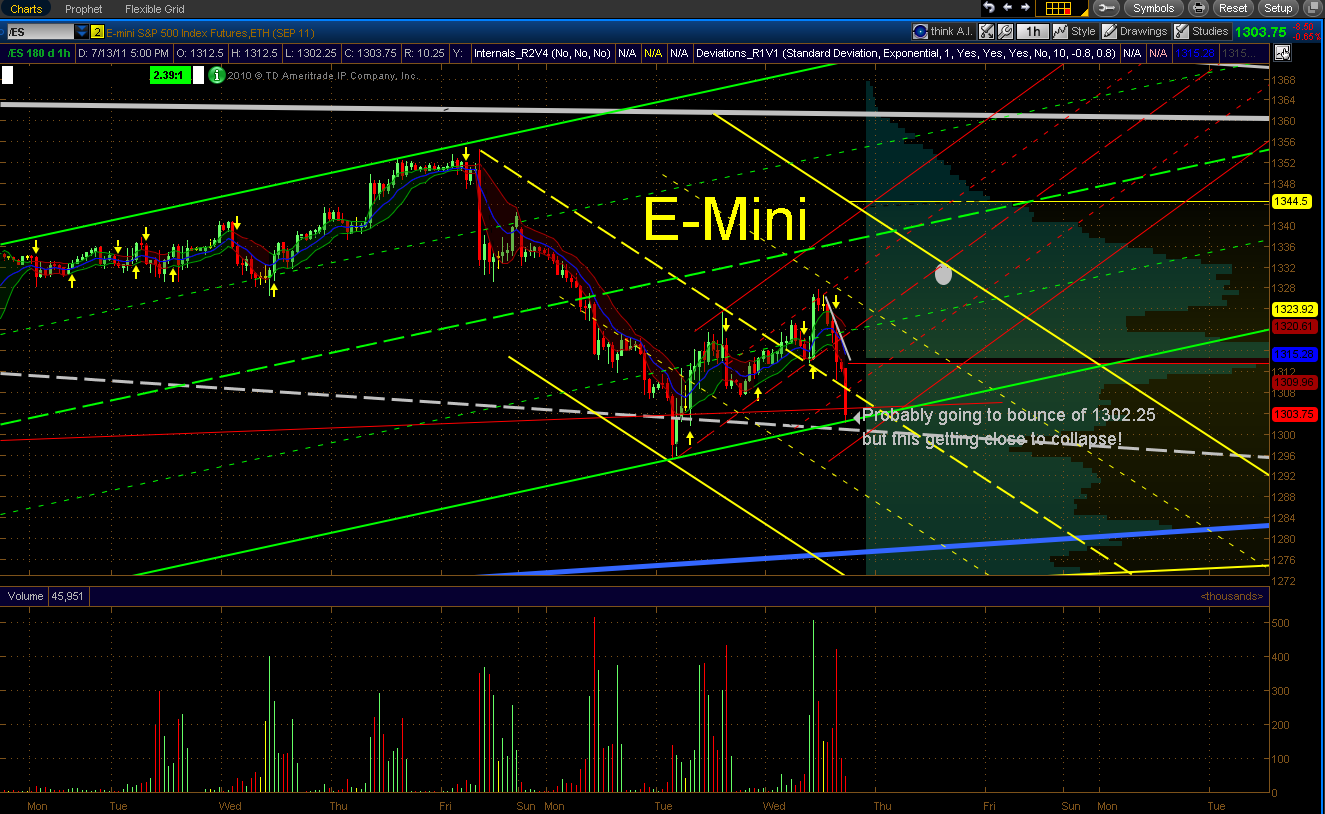
That's OK I would still be Bullish if the Green handle were violated and it appears that it will be due to a need for symmetry in the Blue fork.

13:50
I'm not thrilled about the Green fork, but I want to leave it on until the Yellow fork (Formerly Cyan) becomes established. I'm not thrilled by that one either, but it appears to be the best placement I can find.
I've drawn in some bands to show the trading ranges. By tomorrow we will know whether the Yellow or the Green fork is correct. The immediate blue fork is too steep and will only sever us until Price drops to the lower tine. Use your Fib Fan to get a fix and redraw that fork once more data is available.
The VIX spiked at 19.98. A break below 18.80 may signal a Bullish move in the S&P
Oh well it looks like I type too slow, the VIX just broke.
Watch the E-Mini for a retest of 1319.44. This is most likely just a peak.This little pop is not supported by the Internals.

12:00


Either way the market should find resistance near 1322.
03:45


No comments:
Post a Comment